Pay As You Go - AI Model Orchestration and Workflows Platform

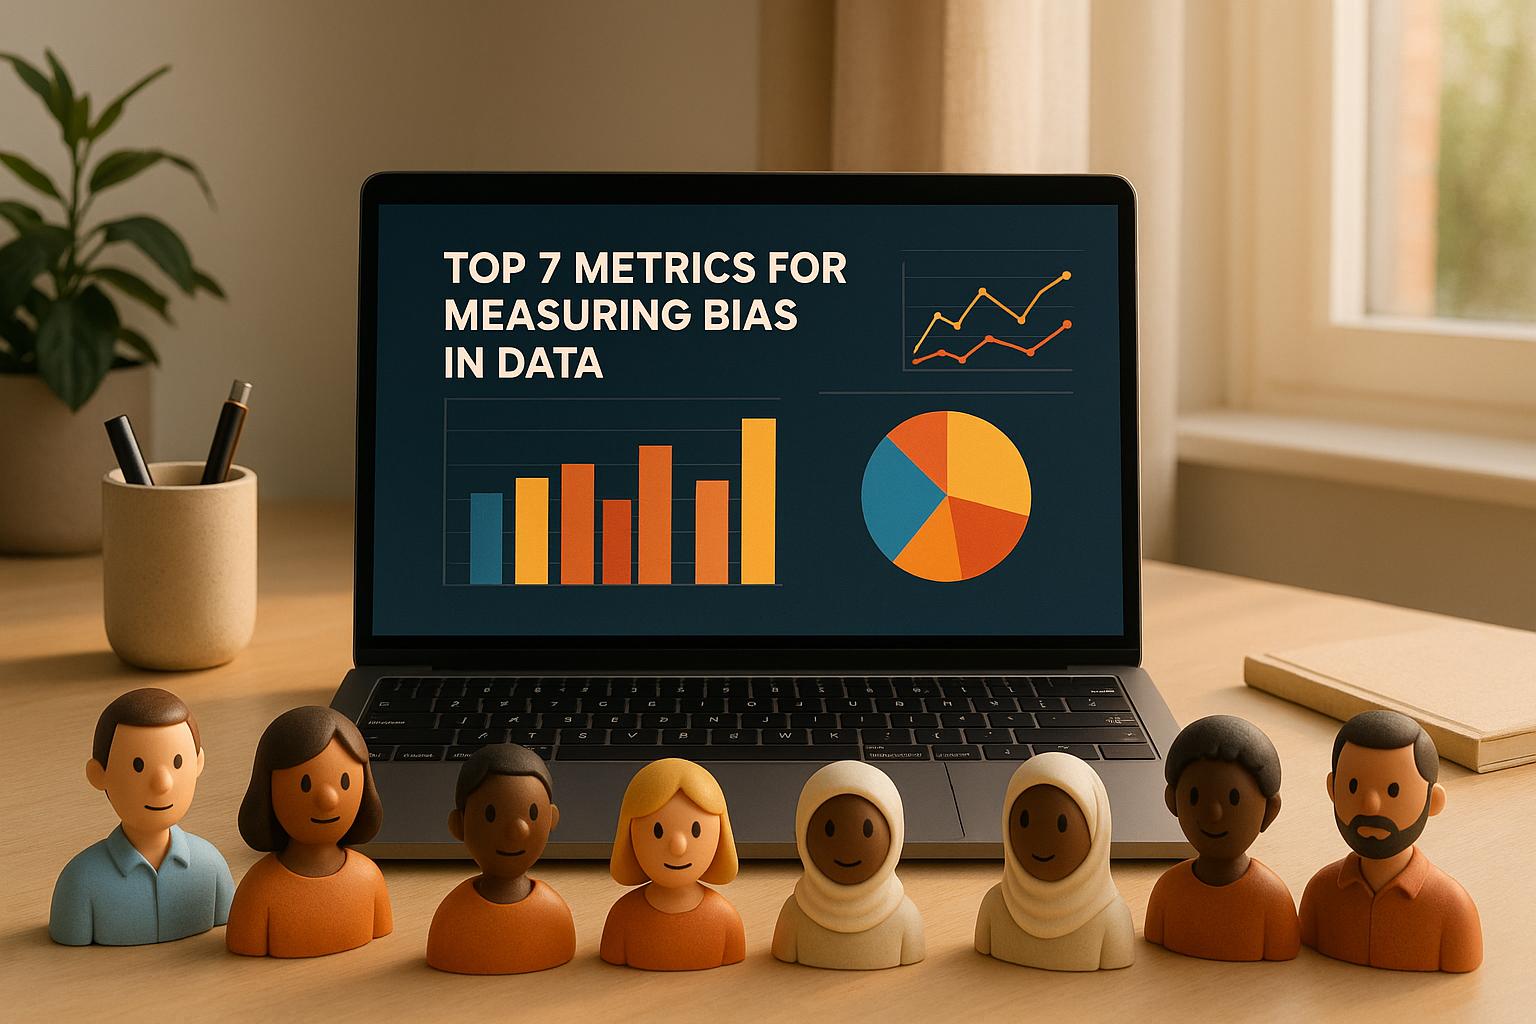
When analyzing data for bias, it's crucial to use specific metrics to identify and address disparities. Here's a quick overview of seven key metrics to help ensure balanced outcomes in AI systems:
Each metric highlights different aspects of bias, and using multiple metrics together provides a more complete picture. Tools like prompts.ai can help automate the process, making it easier to monitor and address bias proactively.
This metric highlights potential bias caused by overrepresentation or underrepresentation of specific groups within a dataset.
It examines how sample sizes are distributed across different demographic groups to ensure they reflect the true population. Many statistical learning algorithms assume that the sample mirrors the overall population distribution. If this assumption is off, models might perform well for groups with larger representation but struggle with those that are underrepresented.
This metric is useful for identifying representational bias in any dataset before diving into deeper analysis. For example, in facial expression recognition studies, researchers often find that some emotions, like "happy", are disproportionately linked to female-presenting individuals.
The accuracy of this metric depends on having reliable population data. Without it, imbalances in selection can compromise the validity of findings, making it harder to generalize results to the broader population.
A classic example of sampling bias occurred during the 1936 Literary Digest survey, which incorrectly forecasted the U.S. presidential election due to non-representative sampling. Similarly, the UK's 2001 Census faced challenges when the controversial poll tax of the 1990s led to an undercount of young men.
In AI, tools like prompts.ai's automated reporting systems can flag population imbalances during data preprocessing. This allows teams to address bias issues early, preventing them from negatively impacting model performance.
Demographic parity ensures that models make predictions without being influenced by sensitive group membership, helping to prevent discriminatory outcomes. Unlike population size differences, this metric zeroes in on bias within model predictions themselves.
Demographic parity evaluates whether positive predictions occur at the same rate across different groups. Mathematically, it’s expressed as:
DP = |P(Ŷ=1 | D=1) - P(Ŷ=1 | D=0)|
Here, Ŷ represents the model's prediction, while D distinguishes between demographic groups (e.g., 1 for the majority group and 0 for the minority group). The focus is on uncovering unequal distribution of opportunities or resources, operating on the principle that such distributions should ideally be proportional across groups.
This metric is particularly effective when there’s a suspicion that the input data may carry biases or reflect inequities present in the real world. It’s especially relevant for binary classification tasks or decisions involving resource allocation - like approving loans, hiring candidates, or distributing resources - where fairness and equal treatment are critical. By comparing prediction rates between groups, demographic parity helps identify disparities that could signal bias.
There are some important caveats. If the dataset already reflects fair conditions, enforcing equal outcomes might lead to unintended consequences. Solely focusing on selection rates can also miss crucial details about outcomes. It’s worth noting that demographic parity is just one tool among many for assessing fairness - it’s not a one-size-fits-all solution.
Demographic parity proves invaluable in fields like credit underwriting, where it can expose hidden biases. For instance, one study found that systematic under-reporting of women’s income skewed default risk predictions, favoring men over women. SHAP analysis traced this bias back to the income feature. In another example, under-reporting women’s late payment rates created the illusion that women had a lower average default risk. Again, SHAP analysis pinpointed the late payments feature as the source of the disparity.
Using tools like prompts.ai, teams can seamlessly incorporate demographic parity metrics into automated reports. This enables continuous fairness monitoring and flags potential issues before they influence critical decisions.
Equal opportunity takes a closer look at fairness by ensuring that qualified candidates, regardless of their demographic group, have an equal chance of receiving positive outcomes. Building on the concept of demographic parity, this metric specifically focuses on fairness in positive results, like getting hired, admitted, or promoted.
This metric evaluates whether true positive rates are consistent across different groups, concentrating solely on cases where the outcome is positive (Y = 1).
Equal opportunity is particularly useful in scenarios where it's more important to avoid excluding qualified individuals than to worry about a few false positives. Think of situations like hiring, college admissions, or promotions .
Despite its focus, this approach isn’t without flaws. One major challenge is defining what "qualified" means in an objective way. Additionally, it doesn’t address disparities in false positives, which means biased criteria could still skew the results .
Consider a college admissions process with 35 qualified applicants from a majority group and 15 from a minority group. Equal opportunity would mean both groups have the same acceptance rate - say, 40% - ensuring fairness in positive outcomes.
For teams using tools like prompts.ai, equal opportunity metrics can be integrated into automated fairness monitoring systems. This allows organizations to track true positive rates across demographic groups in real time, making it easier to spot and address systemic disadvantages in their selection processes.
Predictive parity is all about ensuring that a model's ability to predict positive outcomes is equally accurate across different demographic groups.
At its core, predictive parity checks whether the positive predictive value (PPV) is consistent across groups. PPV reflects how often a model is correct when it makes a positive prediction. If a model achieves the same PPV for all groups, it also maintains an equal false discovery rate (FDR) among those groups.
When a model meets predictive parity, the chances of achieving a positive outcome - among those predicted to succeed - do not depend on group membership. In other words, the reliability of positive predictions is the same for everyone. This consistency is critical in fields where accurate predictions directly impact important decisions.
Predictive parity is particularly valuable in situations where precise predictions are essential. For instance:
A concrete example comes from the Adult dataset, which includes 48,842 anonymized records from the 1994 U.S. Census. In this dataset, 24% of individuals are high earners, but the baseline rate differs significantly: 30% for males and just 11% for females.
While predictive parity can be a useful fairness metric, it has its challenges.
A study from UC Berkeley highlighted another issue: aggregate fairness might not always translate to fairness within individual subgroups, such as departments or smaller units.
In practice, predictive parity is more than just a theoretical concept - it can be applied to real-world AI systems to promote fairness. For example, teams can use tools like prompts.ai to monitor prediction accuracy across demographic groups in real time. This kind of automated tracking ensures that AI-generated recommendations remain consistently reliable, no matter the user’s background.
It’s important to remember that fairness isn’t purely a statistical issue - it’s deeply tied to societal values. Calibration, while necessary, isn’t enough to achieve true fairness on its own. Tackling bias effectively requires a combination of approaches, each tailored to the specific context.
Error Rate Balance takes a straightforward approach to fairness by ensuring that a model's mistakes - whether false positives or false negatives - occur at the same rate across all protected groups. This metric shifts the focus from prediction rates to model errors, emphasizing whether your AI system treats everyone equally in terms of accuracy, regardless of demographic differences.
This metric evaluates whether the error rates of a model are consistent across all protected groups. Unlike other fairness measures that might target specific predictions, Error Rate Balance provides a broader perspective on accuracy. It ensures that both false positive and false negative rates are identical between privileged and unprivileged groups, offering a clearer picture of overall performance. Achieving this balance means that the likelihood of incorrect predictions - whether positive or negative - is the same for all groups.
Error Rate Balance is particularly useful when maintaining consistent accuracy across groups takes priority over achieving specific outcomes. This is especially relevant in situations where you cannot influence the outcome or when aligning the model’s predictions with the ground truth is critical. It’s an ideal metric when the primary goal is fairness in accuracy across different protected groups.
A major challenge with Error Rate Balance is its potential conflict with other fairness metrics. For example, research shows that satisfying predictive parity can disrupt error rate balance when baseline prevalence differs between groups. A case study using the Adult dataset illustrates this: a model meeting predictive parity across genders resulted in a false positive rate of 22.8% for male earners versus 5.1% for female earners, and a false negative rate of 36.3% for female earners versus 19.8% for male earners. This example underscores how optimizing one fairness measure can undermine another. Additionally, studies reveal that bias mitigation strategies often reduce machine learning performance in 53% of cases while improving fairness metrics in only 46%.
Error Rate Balance is especially valuable in high-stakes areas where fairness in accuracy is critical. Applications like criminal justice systems, medical diagnosis tools, and financial risk assessments benefit greatly from ensuring consistent error rates across demographic groups. Tools like prompts.ai can help by monitoring error rates in real time, allowing for quick adjustments before biases influence decisions. While this metric offers a solid mathematical foundation for evaluating bias, it works best when paired with broader fairness strategies that take into account the specific context and societal values of the application. Up next, a detailed comparison of these metrics in a bias metrics table.
Data completeness metrics help identify biases caused by missing or incomplete information in datasets. While fairness metrics focus on evaluating algorithmic decisions, data completeness metrics ensure that the dataset itself represents all necessary groups and scenarios for unbiased analysis. When critical information is absent - especially for specific demographic groups - it can distort results and lead to unfair conclusions.
These metrics assess how much essential information is included in a dataset and whether it sufficiently addresses the scope of the question at hand. They evaluate if key variables are present across all demographic groups and highlight patterns of missing data. This involves examining aspects such as accuracy, timeliness, consistency, validity, completeness, integrity, and relevance. By identifying gaps early, these metrics help prevent issues before model development begins.
Data completeness metrics are most valuable during the early stages of data assessment, before building predictive models or making decisions based on the dataset. They ensure that missing information doesn’t undermine the reliability or trustworthiness of your analysis. Not all missing data is problematic, but the absence of critical information can seriously impact outcomes.
While data completeness metrics are helpful, they don’t guarantee overall data quality. Even a dataset that appears complete can still be biased if it contains inaccuracies, which can lead to costly errors. Additionally, the type of missing data matters: data missing completely at random (MCAR) introduces less bias compared to data missing at random (MAR) or non-ignorable (NI). Addressing these complexities often requires more detailed analysis beyond basic completeness checks.
In marketing analytics, incomplete customer data can hinder personalized campaigns and fair targeting. Similarly, e-commerce platforms may use these metrics to detect when transaction data is missing more often for specific customer segments, which can lead to under-reported revenue and biased business decisions.
"Data completeness plays a pivotal role in the accuracy and reliability of insights derived from data, that ultimately guide strategic decision-making."
– Abeeha Jaffery, Lead - Campaign Marketing, Astera
Tools like prompts.ai can monitor data completeness in real time, flagging patterns of missing data that might indicate bias. Establishing clear data entry protocols, performing validation checks, and conducting regular audits are essential steps to ensure data completeness and minimize bias before it affects critical decisions.
Expanding on earlier bias metrics, these tools are designed to uncover systematic forecasting errors. Consistency and forecast accuracy metrics assess how closely forecasts align with actual outcomes and whether there’s a recurring pattern of overestimating or underestimating. Persistent errors of this kind often signal that predictions may be skewed, making these metrics essential for spotting bias in forecasting systems.
These metrics analyze the difference between forecasted and actual values, focusing on patterns of consistent over- or under-predictions. Two key tools stand out:
"Forecast Bias can be described as a tendency to either over-forecast (forecast is more than the actual), or under-forecast (forecast is less than the actual), leading to a forecasting error." - Sujit Singh, COO of Arkieva
These tools provide a strong foundation for improving forecasting accuracy across a variety of scenarios.
These metrics are invaluable for ongoing monitoring of forecast performance and for assessing the reliability of predictive models across different customer groups or product categories. They’re particularly useful in industries like retail or sales, where demand forecasting plays a critical role. Systematic prediction errors in these cases often highlight deeper issues, and addressing them can prevent operational inefficiencies. Poor data quality, for instance, costs businesses an average of $12.9 million annually.
While these metrics are effective at identifying systematic bias, they don’t reveal the reasons behind prediction errors. For example, a perfect forecast would achieve a Tracking Signal of zero, but such precision is rare. Tracking Signal values beyond 4.5 or below -4.5 indicate forecasts that are “out of control”. Another challenge is that these metrics need a robust history of forecasts to identify meaningful patterns, and short-term anomalies may not accurately reflect true bias.
Retail: Retailers rely on these metrics to determine if their demand forecasting systems consistently underestimate or overestimate sales for specific demographic groups or product categories. For perishable goods, even minor forecast errors can lead to waste or missed revenue opportunities, making bias detection critical.
"The 'Tracking Signal' quantifies 'Bias' in a forecast. No product can be planned from a severely biased forecast. Tracking Signal is the gateway test for evaluating forecast accuracy." - John Ballantyne
Financial Services: Financial institutions use consistency metrics to check if their risk models systematically over- or under-predict default rates for certain customer segments. For instance, over a 12-period window, a Normalized Forecast Metric above 2 suggests over-forecasting bias, while a value below -2 points to under-forecasting.
Both retailers and financial institutions benefit from platforms like prompts.ai, which automate the monitoring of forecast bias. Regularly measuring and addressing forecast errors - and maintaining transparency in how predictions are generated - helps ensure more trustworthy and effective decision-making.
Selecting the right bias metric depends on your specific goals, available resources, and the fairness challenges you're addressing. Each metric has its own strengths and limitations, which can influence your decision-making.
| Metric Name | What It Measures | When to Use | Main Limitation | Implementation Complexity |
|---|---|---|---|---|
| Difference in Population Size | Representation gaps between demographic groups in datasets | For initial data analysis and ongoing monitoring | Doesn't reflect the quality or relevance of representation | Low – involves basic counting and percentages |
| Demographic Parity | Equal probability of positive outcomes across groups | Useful in hiring systems or loan approvals prioritizing equal treatment | Overlooks individual qualifications and merit-based differences | Medium – requires group identification and tracking outcomes |
| Equal Opportunity | Equal true positive rates for qualified individuals across groups | Ideal for cases like credit scoring or hiring, where fairness for qualified candidates is key | Requires precise measurement of qualifications | Medium – relies on accurate ground truth data |
| Predictive Parity | Equal precision (positive predictive value) across groups | Suitable for medical diagnosis or fraud detection where prediction accuracy matters | May not address deeper disparities in treatment | High – involves extensive validation for each group |
| Error Rate Balance | Equal false positive and false negative rates across groups | Important in criminal justice or security screening for balanced error rates | Difficult to achieve consistently across multiple groups | High – demands careful calibration of errors |
Deciding on a fairness metric often involves balancing trade-offs between fairness and accuracy. As highlighted in recent studies, "model-level techniques may include altering training objectives or incorporating fairness constraints, but these often trade off accuracy for fairness". This makes it essential to align the metric with your specific fairness goals.
Metrics also come with varying computational demands. For instance, data-level interventions require handling large datasets, which can be constrained by operational limits. Post-processing methods, which adjust model outputs after generation, often add significant computational overhead as well.
The industry you’re working in also heavily influences metric selection. For example, in lending, where 26 million Americans are considered "credit invisible", Black and Hispanic individuals are disproportionately affected compared to White or Asian consumers. In such cases, Equal Opportunity metrics are particularly relevant. A notable example is the 2022 Wells Fargo case, where algorithms assigned higher risk scores to Black and Latino applicants compared to White applicants with similar financial profiles. This highlights the importance of using multiple metrics to address these disparities effectively.
Best practices recommend employing several fairness metrics together to get a well-rounded view of your model’s performance. Regularly monitoring these metrics ensures you can identify and address emerging bias patterns before they impact real-world decisions. Tools like prompts.ai can help automate this process, enabling organizations to maintain fairness standards across demographic groups while managing computational costs efficiently.
Ultimately, achieving fairness requires finding the right balance between your goals and implementation constraints. By aligning metrics with regulatory and business priorities, you can make informed decisions that support both fairness and practical feasibility.
Identifying bias in datasets is not a one-size-fits-all task - it calls for a multi-metric approach. The seven metrics we've discussed, ranging from population size differences to forecast accuracy, each highlight unique dimensions of bias that may be present in your data. When used together, these metrics offer a fuller picture, uncovering both clear and subtle forms of discrimination.
Bias is complex and cannot be fully captured by numbers alone. While quantitative metrics are essential, deeper investigation is just as important. For instance, earlier studies have shown that focusing on a single metric can easily miss critical disparities. This is why relying solely on one measure can leave significant performance gaps unnoticed.
Using multiple metrics helps avoid blind spots. A dataset might seem balanced in terms of population representation but still reveal major disparities in model outcomes or error rates for specific groups. Such disparities could lead to indirect or proxy bias, especially when seemingly neutral features are linked to sensitive attributes like race or gender.
Automation can make bias detection and mitigation more efficient. Tools like prompts.ai integrate these metrics to enable continuous monitoring, saving time and ensuring thorough analysis.
Beyond meeting compliance standards, addressing bias improves model performance and builds trust with stakeholders. It also protects organizations from reputational and financial risks. Regular audits and ongoing monitoring are key to maintaining fairness as data evolves over time.
Using several metrics to assess bias in AI systems is crucial because each metric reveals unique aspects of bias, like representation gaps, statistical disparities, or fairness across different groups. Sticking to just one metric risks overlooking nuanced or complex biases embedded in the data or the model.
By leveraging multiple metrics, developers can get a broader view of potential biases and tackle them more effectively. This method helps ensure AI systems are evaluated from various angles, promoting fairness and producing results that are more inclusive and dependable.
Relying solely on demographic parity to ensure fairness in model predictions can introduce a range of complications. For one, striving for parity might come at the expense of accuracy, potentially lowering the quality of predictions for specific groups. It also tends to skim over deeper issues embedded in the data, such as historical or systemic biases that require more nuanced approaches.
Moreover, demographic parity often clashes with other fairness metrics, complicating efforts to address the multifaceted nature of fairness in real-world scenarios. By narrowing the focus to this single metric, important societal contexts and complexities may be ignored, resulting in overly simplistic solutions that fail to tackle the broader challenges of fairness in AI systems.
Data completeness metrics gauge how much of the necessary information is present in a dataset. They help pinpoint missing or incomplete data that could skew results or lead to unreliable conclusions. Ensuring datasets are as thorough as possible is key to reducing errors and boosting the credibility of data-driven decisions.
To tackle incomplete data, you can take several steps: establish clear data completeness standards between providers and users, routinely monitor datasets for gaps, and validate the quality of the data. These practices contribute to more reliable datasets, lowering the chances of bias and improving the precision of insights.