7 Days Free Trial; no credit card required

Tokenization pipelines are essential for processing text into machine-readable tokens. But as data grows, ensuring these systems perform well becomes critical. Here's how you can monitor and optimize them effectively:
Monitoring scalable tokenization pipelines requires precise metrics, reliable tools, and regular reviews to maintain performance and compliance while handling increasing workloads.
Tracking the right metrics is essential for keeping tokenization pipelines running smoothly. Without proper monitoring, organizations could face slowdowns, wasted resources, or even compliance risks.
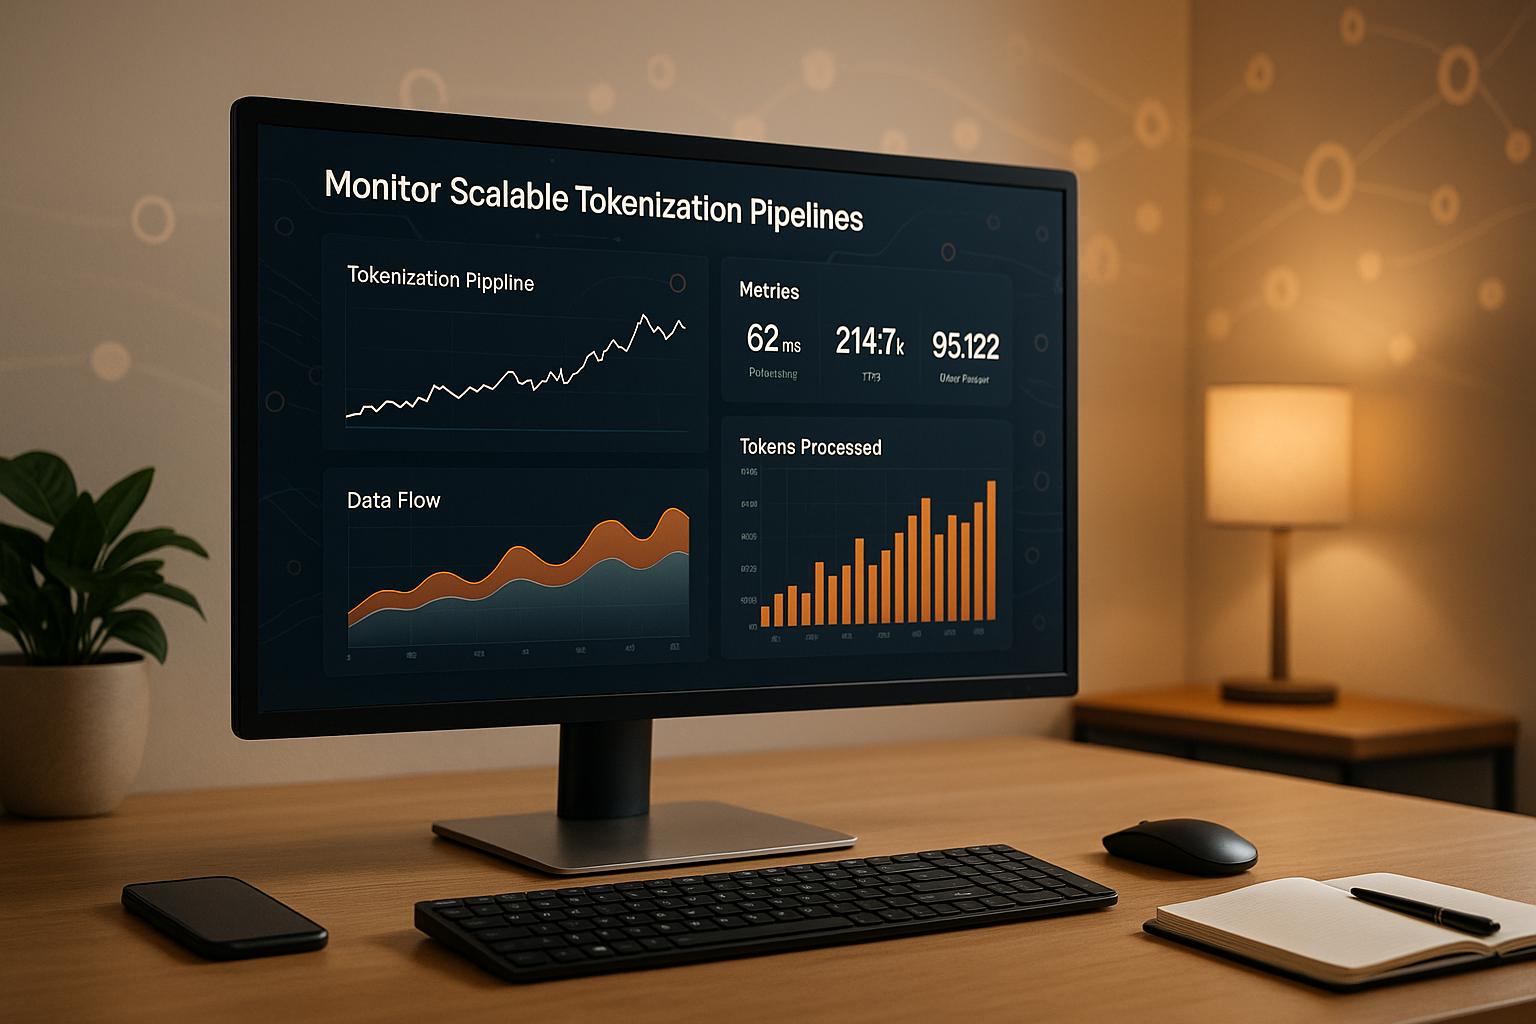
Keep an eye on throughput (tokens processed per second) and latency (total processing time) to identify bottlenecks.
When measuring tokens per second (TPS), it’s important to separate input processing from output generation. Output generation, especially in text-heavy tasks, often takes longer. For workloads where output size exceeds input - like text generation - evaluating TPS offers a clearer picture of performance.
Error rates are another critical area. Track both system errors (timeouts or crashes) and processing errors (failed tokenization attempts) to catch problems early. For processing time, measure the full duration from input to output, including time spent in queues, active processing, and post-processing. Breaking this down by pipeline stage can help pinpoint where delays occur.
Beyond speed and error tracking, efficient resource use plays a big role in pipeline performance.
Monitoring your system’s CPU, memory, and disk I/O is crucial to prevent bottlenecks. With 67% of large enterprises dedicating more than 80% of their data-engineering resources to maintaining pipelines, resource efficiency becomes a priority.
Auto-scaling systems can help adjust computing power based on demand, cutting costs during low-usage periods. Spot instances, for example, can reduce processing costs by up to 90%. Additionally, monitoring for data duplication can lower storage needs and lighten processing loads.
Performance and resource metrics are important, but data quality and compliance are equally critical. Poor data quality can lead to costly inefficiencies, making quality checks a must.
Key aspects of data quality monitoring include:
Transparency is also vital. Maintain detailed audit trails, logging every tokenization operation with timestamps, input sources, parameters, and outputs. This ensures accountability and traceability.
Regulatory compliance is another challenge. GDPR compliance alone costs 88% of global companies over $1 million annually. In 2018, Marriott International faced a $124 million fine under GDPR for data breaches tied to poor data management.
Automated checks can help. By setting validation rules for data entry, processing, and storage, you can reduce human error and enable continuous monitoring. Regular audits further ensure that issues like inconsistencies or inaccuracies are caught before they affect downstream systems.
For platforms like prompts.ai, these monitoring tools integrate seamlessly with pay-as-you-go models, giving users real-time insights into tokenization costs, performance, and quality across connected language models.
Choosing the right monitoring tools is essential, especially as data compromises surged by 78% in 2023. These tools are the foundation of a robust tokenization pipeline.
Modern tools offer real-time visibility and anomaly detection, helping ensure tokenization pipelines run smoothly.
AWS CloudWatch is a strong choice for tokenization workloads. It provides automated alerts when thresholds are exceeded, detailed reports, and scalability to handle growing data volumes without sacrificing performance. For organizations already using AWS, CloudWatch integrates seamlessly with existing services.
Databricks Delta Live Tables simplifies complex data transformations with built-in quality controls. It automatically manages pipeline dependencies and tracks data quality metrics in real time, combining processing and monitoring in one platform.
Snowflake Snowpipe facilitates continuous data ingestion with automatic monitoring. It identifies bottlenecks, tracks loading patterns, and delivers detailed analytics on pipeline performance. Its elastic architecture adjusts to workload demands, ensuring efficiency.
When evaluating monitoring tools, look for features like real-time monitoring, anomaly detection, automated alerts, scalability, integration capabilities, and detailed analytics. The right choice depends on your organization's priorities, whether that's seamless integration, real-time insights, or advanced analytics.
prompts.ai integrates monitoring directly into its pay-as-you-go infrastructure, offering real-time insights into tokenization costs, performance, and usage across multiple large language models. This platform enables organizations to optimize workflows and reduce expenses through detailed analytics and automated reporting.
With real-time collaboration and unified visibility across multiple LLMs, prompts.ai simplifies monitoring and enhances cross-model insights. Its multi-modal AI workflows include built-in monitoring for tasks like text processing and content generation, tracking each component individually to identify bottlenecks and optimize performance. Additionally, encrypted data protection ensures monitoring data stays secure.
Compared to traditional solutions, prompts.ai stands out for its scalability and cost efficiency, making it a compelling choice for modern tokenization needs.
Each monitoring tool has its strengths, and the best option depends on your organization's infrastructure and priorities.
In contrast, prompts.ai incorporates monitoring as a core feature, scaling automatically with usage. This addresses challenges traditional tools face when managing high-volume tokenization data.
Compliance is another critical factor, especially as regulations grow stricter. With the tokenization market projected to reach $9.82 billion by 2030, prompts.ai provides built-in compliance features to ensure secure and transparent operations. Traditional tools, however, may require additional configuration to achieve the same.
Cost structures also vary. Traditional tools often charge based on data volume or retention periods, which can become expensive for high-volume pipelines. prompts.ai's pay-as-you-go model aligns costs with actual usage, offering more predictable and often lower expenses.
Ultimately, the decision comes down to your organization's needs. Companies already committed to a specific cloud ecosystem might prefer native tools like CloudWatch or Databricks Delta Live Tables. However, for those seeking unified monitoring across multiple LLMs with integrated cost optimization, prompts.ai offers a comprehensive solution for modern tokenization workflows.
Keeping tokenization pipelines reliable, secure, and efficient as they grow isn’t just about setting up tools - it’s about applying strategic practices that ensure everything runs smoothly.
Centralized logging is your first line of defense for keeping track of pipeline activity. By gathering logs from all components - like tokenization processors, storage systems, and network infrastructures - you create a single source of truth. For instance, consolidating logs from AWS services and using JSON formatting can simplify analysis and filtering.
When it comes to alerts, smart alerting helps avoid overload while ensuring critical issues get immediate attention. Set up alerts based on severity levels: minor issues might trigger an email, but breaches or system failures should send urgent phone alerts. For example, you could use CloudWatch Logs Metric Filters to detect patterns, set alarms, and automate responses through EventBridge rules.
Log retention policies are another key piece. Balancing compliance and storage costs is essential - operational logs might only need to be kept for 30 days, while security logs could require a year or more depending on regulations. Actionable dashboards that highlight the most important metrics can help users focus on what matters without being overwhelmed by data.
After getting your logging and alerting in place, regular audits can further strengthen your pipeline’s reliability.
Data issues can be expensive, so regular compliance audits are a must. These audits help verify that your data protection measures are effective and can uncover vulnerabilities before they escalate. Key areas to focus on include data privacy, security, auditability, and regulatory compliance.
Keeping detailed documentation and audit trails ensures transparency and accountability. By maintaining clear records of issues and how they were addressed, you’ll be ready for regulatory reviews and can demonstrate compliance when needed. For example, a hospital dealing with patient data must encrypt information during processing to meet HIPAA standards, while a payment processor must use tokenization and conduct penetration tests to comply with PCI DSS.
Once compliance is under control, your next step is to fine-tune resources and performance.
Scaling and tuning your resources is critical for managing workloads efficiently. With dynamic resource allocation, tokenization pipelines can adjust to workload demands without manual intervention. Automated scaling tools like AWS Auto Scaling can help match resource usage to demand, while parallel processing and data caching can reduce processing times and improve efficiency.
Load balancing plays a vital role in distributing workloads evenly, preventing any single system from becoming overwhelmed. Additionally, compressing data can speed up transfers and lower bandwidth requirements.
When it comes to storage optimization, choosing the right format can make a big difference. For batch processing, columnar formats like Apache Parquet and Apache ORC are ideal, while real-time processing benefits from formats like Apache Avro and Protocol Buffers. Tools like Apache Hadoop and Spark can handle large-scale processing needs, with Spark’s in-memory processing particularly suited for iterative tasks.
Continuous monitoring is the cornerstone of performance optimization. By keeping an eye on pipeline performance, you can catch bottlenecks and inefficiencies early. As the Eckerson Group explains:
"Data observability provides a granular understanding of how pipeline jobs will interact with infrastructure elements such as data stores, containers, and clusters..."
This kind of observability ensures your pipelines maintain high quality and accuracy while alerting you to potential issues. Managed solutions like AWS Glue and Google Cloud Dataflow can also help by scaling dynamically and reducing the need for manual oversight.
Performance tuning is an ongoing process. Regularly reviewing metrics and gathering user feedback can help identify new optimization opportunities, ensuring your pipelines stay efficient as data volumes grow and processing needs evolve.
Taking the monitoring metrics discussed earlier a step further, integrating analytics can significantly enhance pipeline oversight. By linking monitoring data with analytics tools, you can turn raw metrics into meaningful insights. This integration transforms scattered data points into cohesive dashboards and automated reports, enabling smarter, data-driven decisions.
The first step in effective analytics is integrating monitoring outputs with robust platforms. Tools like Amazon OpenSearch or Redshift allow you to visualize performance trends and uncover patterns that might otherwise go unnoticed.
To maintain consistency and prevent integration hiccups, it’s essential to implement schema validation at pipeline entry points. This ensures data quality remains intact throughout the process. Strategic logging and alerting also play a vital role by using historical data to predict potential issues and tracking metadata and lineage to better understand data relationships.
Real-time integration can be a game-changer for organizations. For example, Walmart, in 2019, used advanced analytics and machine learning to connect data from its website, inventory, and in-store sales. This effort improved inventory turnover by 10% and boosted online-to-in-store conversions by 20%. Similarly, Starbucks adopted a data analytics platform in 2016 to process customer feedback and sales data instantly, leading to a 12% increase in customer satisfaction within six months.
By linking monitoring and analytics, businesses can bridge the gap between raw data and actionable insights, laying a foundation for automated decision-making.
Automated reporting takes the hassle out of manual processes by generating reports based on predefined parameters. This approach can save up to 80% of the time spent on manual reporting, with adoption rates exceeding 60%. The entire process - data collection, processing, analysis, visualization, report generation, and distribution - happens seamlessly without human intervention.
For example, prompts.ai simplifies compliance reporting and dashboard creation for tokenization pipelines. Its pay-as-you-go model tracks tokenization usage across interoperable LLM workflows, automatically generating detailed usage reports and cost summaries.
However, maintaining high data quality is crucial in automated systems. Implementing strong data profiling, cleansing, and validation practices ensures the accuracy of reports. To get started, focus on creating specific, measurable KPIs aligned with your business goals. Begin with high-impact reports and gradually expand automation using tools like Apache Airflow or cron jobs.
A real-world example comes from United Way Northwest Indiana, which automated its data flows from marketing and CRM applications. This reduced manual reporting time by about 80 hours per month and saved $20,000 annually in labor costs.
Automated reporting not only saves time and money but also establishes a framework for continuous performance monitoring.
Regular reviews are essential to ensure your monitoring and analytics integration keeps pace with evolving tokenization pipelines. These sessions provide opportunities to analyze trends, refine configurations, and optimize performance.
Performance reviews can lead to a 14% increase in productivity. Incorporating predictive modeling or machine learning algorithms can further enhance these reviews by automatically identifying trends or anomalies.
Establishing and updating data governance policies is also critical. These policies clarify roles and responsibilities in maintaining data quality. As Mo Hallaba, CEO of Datawisp, puts it:
"It's not just about working with data in a vacuum. The reason that we do all this stuff with data is because we're trying to understand something about our business that we didn't know before we looked at the data".
Key metrics to monitor during reviews include throughput, latency, error rates, and data freshness. Smart alerts that combine threshold-based triggers with anomaly detection help teams focus on the most critical issues. Additionally, regular backups and system performance monitoring ensure your analytics infrastructure remains reliable and ready to handle growing data demands.
Keeping tabs on scalable tokenization pipelines demands a well-thought-out architecture, precise metrics, and a strong adherence to best practices. The cornerstone of this approach is breaking down large pipelines into smaller, interconnected components, enabling teams to monitor each part independently. This modular strategy lays the groundwork for effective operational monitoring across the entire pipeline.
A key factor in achieving success lies in setting up centralized logging and alerting systems. These systems act as a unified source of truth for the entire pipeline, drastically cutting down recovery times. By adopting structured logging formats like JSON and configuring real-time alerts based on predefined thresholds or anomaly detection, teams can respond swiftly to issues, minimizing downtime.
Data quality is another non-negotiable priority during monitoring. According to a Forrester survey, 77% of respondents identified data quality as their top challenge in observability efforts. To address this, organizations must enforce validation rules at both the ingestion and processing stages. Critical metrics to monitor include throughput, latency, data completeness, consistency, accuracy, and error rates. Once data quality is assured, turning metrics into actionable insights becomes much simpler.
Combining monitoring tools with analytics and automated reporting can transform raw data into strategic insights. For example, platforms like prompts.ai, with their pay-as-you-go tokenization tracking, demonstrate how modern solutions can simplify this process while ensuring compatibility across various large language model workflows.
Regular audits and performance evaluations are essential for refining your monitoring strategy as pipelines grow. By prioritizing end-to-end visibility and implementing role-based access controls, organizations can ensure both security and compliance while scaling their operations. This aligns with earlier discussions on resource scaling and performance optimization. Starting with clear, business-aligned metrics and gradually expanding automation and monitoring capabilities ensures the pipeline evolves alongside organizational needs.
Ultimately, successful monitoring of scalable tokenization pipelines hinges on embedding monitoring into the architecture from the start, rather than treating it as an afterthought. With centralized logging, continuous quality checks, and analytics integration, organizations can achieve the reliability and performance necessary to support their expanding AI and NLP projects.
When keeping tabs on a tokenization pipeline, it's essential to pay attention to these key performance metrics:
By monitoring these metrics, you can quickly pinpoint bottlenecks, enhance system efficiency, and maintain consistent data quality - all while keeping the process scalable and cost-efficient.
To keep data quality in check and ensure compliance within tokenization pipelines, organizations should rely on automated validation and quality checks at every stage. This involves tasks like verifying schemas, spotting duplicates, identifying missing data, and flagging outliers. These proactive measures help catch problems early, preserving the integrity of the data.
Embedding these checks directly into the pipeline guarantees consistency and aligns with regulatory requirements. By automating these processes, businesses can minimize manual errors, simplify workflows, and meet stringent data demands without compromising efficiency.
Integrating monitoring, analytics, and automated reporting into your tokenization pipeline brings several practical advantages. It enables precise data tracking, delivers real-time insights to support smarter decisions, and helps catch and address potential issues early on - before they turn into bigger problems.
This streamlined approach can improve workflow efficiency, cut down on operational expenses, and increase the overall dependability of your pipeline. These enhancements not only save valuable time but also reinforce confidence in your data processes, ensuring reliable outcomes at every step.